Answering Queries Offline with Sweepline
You are given an array and several queries. A query consists of a subarray and $x$. Print the sum of all elements from this subarray that are $\leq x$.
The current query consists of 2 operations : Sum of elements, and rejecting elements that are greater than $x$. As such, it is difficult to optimize it to better than $O(n)$ per query. To allow scope for optimization, let us try to completely remove the reject element operation.
Notice that the queries can be answered offline. This means that you are allowed to precompute the answer to all queries in whichever order you want and only print the answers at the end. Let’s try to answer queries in increasing order of their $x$ values.
Let us start by plotting all the array values (denoted by green dots) and all the $x$ mentioned in the queries (denoted by red dots). The numbers below each dot represents its value. For example, at $x = 3$ there are 2 green dots. This means that the array contains two occurrence of $3$ at some location. Similarly, there are 2 red dots at $x = 7$. This means that two of the queries contain $x = 7$.
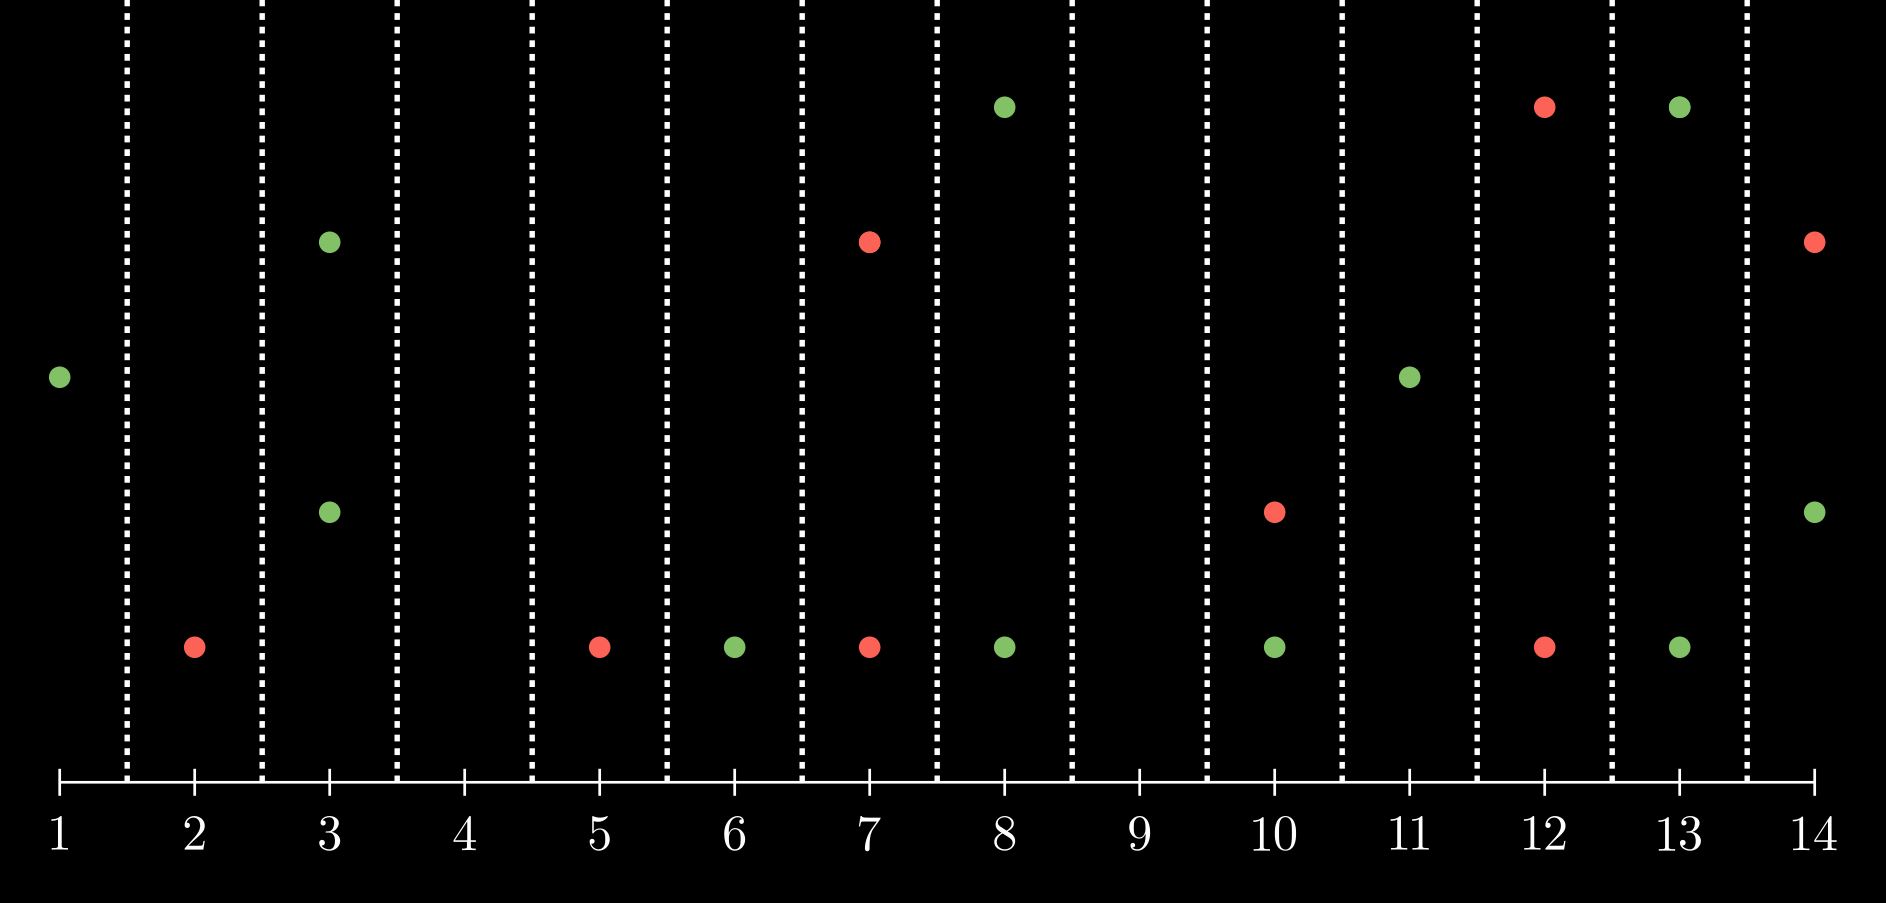
How do we efficiently answer the queries using this diagram? First, let us sort all the queries by their $x$ values. This means that we’ll traverse this diagram from left to right and try to find the answer for the first red dot, then for the second red dot and so on…
All green dots that are to the right of the current red dot do not contribute to the answer.
Recall that the green dots represent the array values. Suppose the current red dot is at $x$. Then, all the green dots to the right of $x$ have value $> x$. So, even if we were to add it to the subarray being investigated, it would contribute 0 to the final sum. Hence, we can just pretend that the green dots to the right of the current red dot are irrelevant. The green dots to the right of a red dot are precisely the elements that were going to be rejected while computing the answer for that query.
Let’s initialise the array as $[0, 0, \dots 0]$ and start our journey.
- At time $t = 1$, you encounter a green dot. This means that there is some array index that contains the value $1$. So, we recall that index, say $i$, and set $a[i] = 1$.
- At time $t = 2$, you encounter a red dot. This means that there is some query whose $x$ value is $2$. So, we recall that index, figure out the corrresponding $L$ and $R$ and then sum up ALL the values in that range. Why would blindly summing up $a[L \dots R]$ work? Because we haven’t seen any elements $ > x$ so far.
- At time $t = 3$, 2 new green dots appear. Hence, we locate the corresponding indices and set the value to $3$.
- At time $t = 4$, nothing happens.
- At time $t = 5$, a red dot appears. We can find out the corresponding $L$ and $R$ and print the subarray sum.
- At time $t = 6$, a green dot appears. We locate the corresponding index and set its value to $6$.
- At time $t = 7$, 2 red dot appears. This means that we need to answer 2 queries (with possibly different $L$ and $R$) but with same $x$. Just like before, we can get the entire subarray sum and print the answer.
If we iterate the queries as well as the array elements in increasing order (simultaneously), the operation simplifies to sum of a subarray and updating a particular index. This technique is known as Sweep Line. You plot entities with different colours and start traversing the number line from left to right, one step at a time. Every time you take a step, you encounter some entities for each color. These are known as events. Then, you decide on what to do with those entities, precompute the answer to some queries and then move on to the next step. The dotted lines are the ones sweeping the plane from left to right and witnessing certain events at each timestamp.
Note that the time complexity of the naive implementation would be $\mathcal{O}(10^9 \cdot n)$. However, the naive interpretation is what will help you come up with solution to new problems that use sweep line. Think about what happens when you are $t = 1, 2, 3 \dots 10^9$. Then, once you have the naive sweep line algorithm, it’s not a difficult task to add some optimizations.
a = [0 .... 0]
for t in range(1, 10^9):
    # Locate all green dots and add them to the array
    for all i such that original_array[i] = t:
        a[i] = t

    # Locate the red dots and answer the query
    for all q such that query[q].x = t:
        ans[q] = sum(a[query[q].L ... query[q].R])

print(ans)
Now, let us talk about some optimizations that we could do to improve the time complexity. First, let us remove the outer loop that iterates over each timestamp from $1$ to $10^9$. Notice that a lot of timestamps would contain no green dots or red dots, for example $t = 4$ and $t = 9$ in the image. In fact, there can be only a maximum of $n + q$ different vertical lines that contain a green/red dot.
Let’s sort the array elements (along with record for their original indices) as well as query elements (on the basis of $x$). We will only iterate over the red dots in increasing order of $x$. Suppose the current line is sweeping $t = x$. Then, since the array elements are sorted, we can figure out which green dots are missing after the last line sweep.
for i in range(n):
    sorted_a.append({a[i], i})
sort(sorted_a)
last_index = 0
for t in sorted(queries.x):
    # Locate all green dots that appeared after the last sweep
    while(last_index < n and sorted_a[last_index].value <= t):
        a[sorted_a[last_index].i] = sorted_a[last_index].value

    # Locate all red dots on this line and answer them
    # Find index q such that query[q] = t and answer it.
    ans[q] = sum(a[query[q].L ... query[q].R])

print(ans)
The time complexity is now $\mathcal{O}(n^2)$. To further optimize it to $\mathcal{O}(n \cdot log(n))$, we need a data structure that can support range sum and point update. Segment Tree is one such data structure. Luckily, Atcoder Library provides a segment tree API that can be used as a black box. For more details, refer to the my code.
You can find the code here
You are given a tree and some queries. In each query $(x, y, T)$ print YES if there is a path from $x$ to $y$ such that the maximum value on that path is $ \leq T$.
This is a fairly standard follow up problem to sweep line. I will add my solution and explanation after a couple of AC submissions on the practice contest. If you need any hints for this problem, or if you are unable to use Atcoder’s segment tree library on Codeforces, you can ask on my discord server or twitter